Probability of an Event
One of the challenges with Security Risk Assessment is the analysis of rare but catastrophic events. Events for which we often lack solid data and, by definition, are abstract and unlikely, but with consequences so dire that we cannot ignore them. And sadly, they are more common than we might expect.
Catastrophic attacks with a tiny likelihood of occurring in any given year are almost certain to happen over a longer horizon. In the words of Chuck Palahniuk in the novel, Fight Club, “On a long enough time line, the survival rate for everyone drops to zero.”Consider the maths of calculating the probability of an event such as the metaphorical one-in-one-hundred year storm, or a notional Black Swan event such as 9/11.
If we call P the probability of attack ‘A’ happening in any given year, we can express this as: P(A) = 1% = 0.01
The chance of not having a P(A) even this year, denoted as P(A’) and pronounced P of A-prime, is therefore 1-P(A), or 99% (1-0.01 = 0.99)
The likelihood of having no ‘A’ for 2years = P(A’) * P(A’) = P(A’)2=0.99*0.99 = 0.9801
P(A’ for X years) = P(A’)X. Therefore P(no attack of type A for 30 years) =P(A’)30= 0.9930= 0.7397
This means that over a thirty-year period, the probability of not having an attack of type A is approximately 74 percent. By inference, the probability of one attack of type A in the next 30 years is more than one in four (26%).
Now consider four other rare, but catastrophic attacks, each with no correlation to each other. They could be anything but let’s say for example: cyberattack, bombing, active shooter, and information breach. At the risk of over-simplifying independent versus dependent probability, if the chance of any individual event happening in the next 30 years is 26%, the likelihood of anyone happening the same period is 100%.
When we grow the list of rare events, the likelihood of an attack happening with near certainty goes from once in 100 years, to one in 30 years, to 20 years, to 10 years, etc. In other words, the next rare, but extreme attack may be just about to happen.
Modeling Risk Expectancy
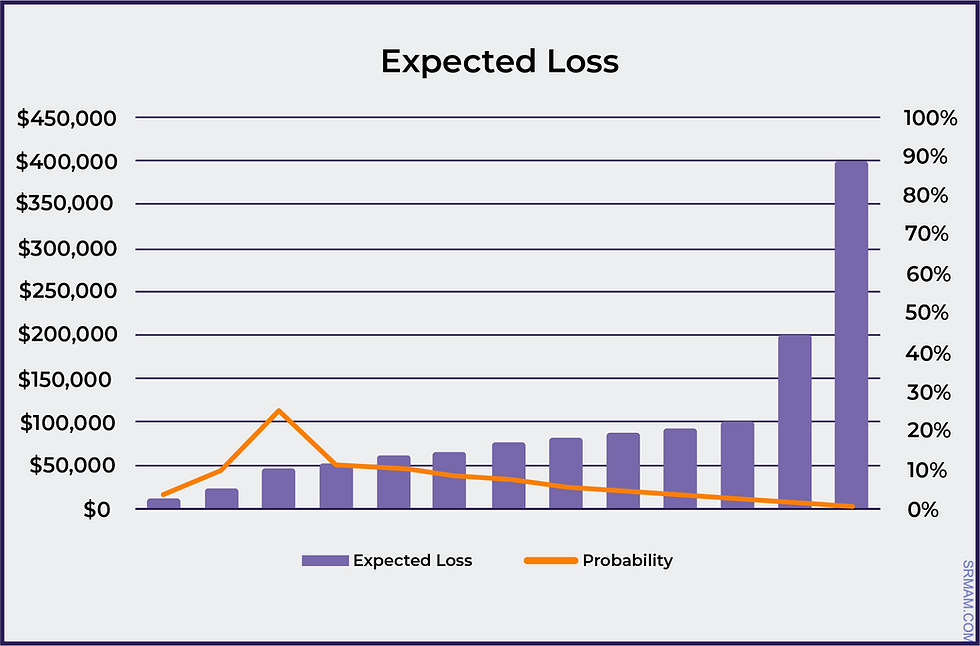
By spreading the outcomes such that the total percentage is 100% you can effectively say, this is the total range of possible outcomes, and produce an EMV.In this case it is $61,750. From the chart, you can also see the most likely range of losses, and the potential outliers for the worst case.The following example and chart is for just one hypothetical risk which considers, for example, the expected costs (based on historical data, other evidence or expert judgement) of loss due to shoplifting over the coming 12 months.

If you did this for a range of other risks, then calculated the aggregated scores for key risks in this fashion, a probability curve for expected loss can be plotted. This at least provides a view of the potential range of consequences, including extreme outliers, and provides insight for management as to the level of uncertainty.

Douglass Hubbard and Richard Seiersen explain all this and much more in great detail in their book, How to Measure Anything in Cybersecurity Risk¹. Ultimately the purpose is to inform decision-making and help determine which risks require priority treatment and to what extent.
¹ Hubbard, Douglas W., and Richard Seiersen. How to MeasureAnything in Cybersecurity Risk. Hoboken: Wiley, 2016.

コメント